Data Home | Math Topics | Environment Topics | Topics Matrix | Master List | Help

Download the Data

PDF

Excel File

Text File

Minitab File

Data Set #067

About the Data
View the Data
Help with Using Data

  Go to Top  

About the Data

About UK oil spills:

    Many phenomenon, such as oil spills, show a characteristic frequency distribution of event sizes over time, with many small oil spills, some medium sized events, and uncommon large oil spills. Other hazardous phenomena which show this kind of frequency distribution over time include forest fires, nuclear accidents, earthquakes, automobile wrecks, landslides, and some volcanic eruptions. Other objects, such as stream networks, veins in the body, and city streets, also show this same size distribution. In general, objects (or phenomena) which are self-similar in geometry ("fractal" or scale independent) will show this characteristic frequency distribution.

    Oil spills in the marine waters (open sea to closed estuary) of the United Kingdom were analyzed from January 1989 to December 1998 (9 years) in a comprehensive report by Safetec UK Ltd. to DETRA (see below). The report contains a lot of great information and analysis, including the sizes of every reported oil spill (in metric tonnes) for spills greater than or equal to 1 tonne, for a total of 261 oil spills.

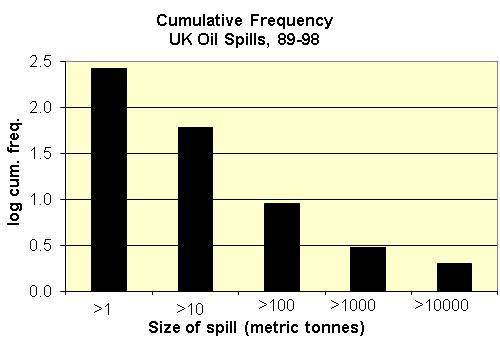
    The data have been reconfigured to express the frequency of oil spills greater than or equal to a certain size category, rather than the frequency of spills of a certain size range (the more typical method of presenting frequency information). This data configuration is analogous to cumulative frequency. There are a number of reasons for expressing the data in this form. For example, if the sample is not large, there may be bins (intervals) with no events of that size, which can create problems when using logarithms.

    If the object or phenomena is self-similar or "fractal", then the object or phenomena will typically show a "power law distribution" of sizes, with a linear relationship between the logarithms of size and cumulative frequency. The UK oil spill data seem to behave in this fashion; the students can do the math, and determine the goodness of fit to a power law model. With a bit of algebra, students can also calculate the parameters to the power law model.

    With the power law model in hand, students can estimate the recurrence interval (by extrapolation) of very large oil spills that may have not even occurred yet. For example, what is the recurrence interval for an oil spill of 1 million tonnes in UK waters?

    Source: UK Department for Environment, Transport and Regions Report on "Identification of Marine Environmental High Risk Areas in the UK", Report # ST-8639-MI-1-Rev 01 . Appendix 3 has the data.

http://www.defra.gov.uk/environment/consult/mehra/pdf/chaps1-4.pdf

     
  Go to Top  
View the Data

Oil spills in the marine waters of the UK, 1989-1998
Source: UK Dept. of Environment, Transport and Regions report
       
tonnes bin cum freq log cum f
20 1-10 260 2.41
2 10-100 60 1.78
7.6 1000-1000 9 0.95
1.9 10000-10,000 3 0.48
3.9 10000-100000 2 0.30
2      
3      
4.2      
2.3      
1.2      
2      
700      
2      
1.9      
19      
84      
15      
5.1      
27      
1.5      
3.9      
1      
85      
1      
5      
220      
1073      
20      
11.7      
1.1      
2      
1      
1.7      
1      
10      
20      
11.4      
4.5      
1      
20      
6      
30      
10      
20.2      
1.3      
1.5      
3      
12      
33.3      
50      
4      
2      
1.6      
2      
5      
2.2      
2.6      
10      
1.6      
3      
1      
2      
1.4      
1      
1.1      
4      
1.1      
8.3      
3      
10      
4      
4.1      
2.3      
30      
20      
9.4      
17      
6.9      
52      
25      
10      
29      
2.5      
86248      
6.5      
3.9      
1      
5      
2.7      
2.6      
1      
3      
7      
7.5      
1      
5      
39      
3.5      
1.5      
3.6      
3      
6.3      
15      
4.4      
373      
6      
1.1      
1      
1      
50      
7.8      
2.7      
3.1      
3      
1      
150      
6      
1.2      
2      
15      
5      
1.4      
2      
2      
1.5      
20      
3.6      
1.6      
2      
3      
4.5      
2.5      
15.2      
7.7      
600      
3      
5      
5.4      
3      
23      
1.4      
1.8      
4      
4.5      
10      
3.9      
1.1      
6.9      
5      
16.7      
8      
5      
60      
4.5      
5      
3      
1      
1.9      
14      
1.2      
4      
1.2      
1.2      
1.9      
1      
2.9      
1.5      
2.5      
2      
22.7      
45      
1.2      
1.9      
4.5      
1.6      
1      
2.3      
2      
1      
5.1      
21.8      
1.6      
72000      
3.9      
1      
1.8      
1      
11.2      
1.2      
2.8      
5.2      
7.8      
2      
3      
6.2      
1      
1      
1      
1.9      
2      
1.7      
5      
2.1      
12.9      
3.2      
1.6      
1.4      
1.7      
4      
2.8      
2.5      
1.1      
3.2      
15      
2.5      
5      
1.5      
1.3      
9      
1      
1      
2.3      
1      
3.1      
1      
10      
1      
2      
6      
5      
5      
4      
5      
239      
4.5      
2      
2      
1      
15.9      
3      
10      
1      
1      
1.5      
8      
1.1      
13      
1      
2      
1      
18.2      
3.2      
15      
1.5      
4      
5      
15      
3      
3      
13.6      
2      
Go to Top