|
About the Data
About hydropower by state
Hydroelectricity generated by dams has some environmental advantages over other sources of
electricity such as nuclear reactors and coal-fired power plants. Hydropower generates essentially no greenhouse
gases and produces essentially no solid or toxic wastes, once the facility is constructed. Hydropower is renewable;
no finite resources such as uranium ore, coal or petroleum are consumed, once the facility is built. Hydropower
also can re-use the same water over and over to generate electricity, if a single river or stream has a series
of facilities along its course. Hydropower is not without its problems, however. Dams alter habitat in many ways;
fertile agricultural valleys are often lost, salmon and other migratory fish are severely impacted, etc.
The United States Geological Survey has compiled data on the hydroelectric power production
of each state and territory in 1990, as well as the amount of water used to generate this electricity. Though not
stated, hydropower presumably includes both dams and in-stream turbines, though dams must account for practically
all of the production. The units are quite interesting. Water use is given in millions of gallons per day; Washington
State uses the better part of a million million gallons every day. Why did the USGS choose the very tiny unit,
gallon per day? Electricity production is given in millions of kilowatt-hours; a million kilos is a billion, thus
the data are actually given in Gigawatt-hours. Washington generates just under 105 Gwh of hydroelectricity
each year; how many hours in a year, and therefore how much hydroelectric capacity is there in Washington State?
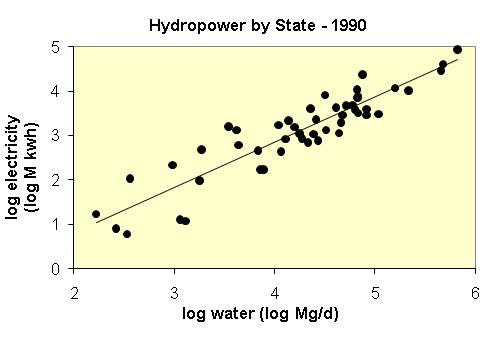
The data range over 4 or 5 orders of magnitude, making it difficult to see the data on a
conventional linear diagram. The scatterplot shows the logarithm of water use versus the logarithm of hydroelectric
production. As might be expected, there is a strong positive correlation between these two variables, though with
some scatter. The student should recognize that this scatter is actually quite large, as each increment on the
graph represents one order of magnitude in size. Students can fit a linear regression to the "logged"
data, and then use algebra to determine the best fit power law regression, if necessary. Is the data actually linear?
The graph might give some indication of the efficiency of hydropower generation. Points below
the line indicate larger quantities of water used to generate smaller amounts of electricity than the "average"
represented by the regression; Iowa, Kansas, and Rhode Island, for example. Why are these states inefficient? Points
above the line might indicate higher efficiency; California, Colorado and Nevada, for example. Why are these states
efficient?
Reference: U.S. Department of the Interior, Estimated
Use of Water in the United States in 1990, USGS National Circular
1081. http://water.usgs.gov/watuse/wucircular2.html.
|
|
View the Data
|
1990 hydropower data from the USGS
|
|
water used to generate hydropower in Millions of gallons per day
|
|
electricity generation in Millions of kilowatthours
|
|
state
|
water (Mg/d)
|
elec (M kwh)
|
log water
|
log elec
|
|
Alabama
|
218,199
|
10,340
|
5.34
|
4.01
|
|
Alaska
|
1,790
|
98
|
3.25
|
1.99
|
|
Arizona
|
31,801
|
8,180
|
4.50
|
3.91
|
|
Arkansas
|
60,367
|
4,885
|
4.78
|
3.69
|
|
California
|
75,013
|
23,906
|
4.88
|
4.38
|
|
Colorado
|
4,161
|
1,318
|
3.62
|
3.12
|
|
Connecticut
|
6,875
|
452
|
3.84
|
2.66
|
|
Delaware
|
0
|
0
|
|
|
|
D.C.
|
0
|
0
|
|
|
|
Florida
|
7,257
|
173
|
3.86
|
2.24
|
|
Georgia
|
51,678
|
4,706
|
4.71
|
3.67
|
|
Hawaii
|
264
|
8
|
2.42
|
0.90
|
|
Idaho
|
67,778
|
7,447
|
4.83
|
3.87
|
|
Illinois
|
27,108
|
771
|
4.43
|
2.89
|
|
Indiana
|
11,598
|
441
|
4.06
|
2.64
|
|
Iowa
|
1,148
|
13
|
3.06
|
1.11
|
|
Kansas
|
1,302
|
12
|
3.11
|
1.08
|
|
Kentucky
|
83,008
|
2,880
|
4.92
|
3.46
|
|
Louisiana
|
21,667
|
697
|
4.34
|
2.84
|
|
Maine
|
82,676
|
3,962
|
4.92
|
3.60
|
|
Maryland
|
25,912
|
2,307
|
4.41
|
3.36
|
|
Massachusetts
|
24,534
|
1,090
|
4.39
|
3.04
|
|
Michigan
|
109,602
|
3,043
|
5.04
|
3.48
|
|
Minnesota
|
18,808
|
843
|
4.27
|
2.93
|
|
Mississippi
|
0
|
0
|
|
|
|
Missouri
|
13,904
|
2,192
|
4.14
|
3.34
|
|
Montana
|
66,797
|
10,688
|
4.82
|
4.03
|
|
Nebraska
|
12,947
|
833
|
4.11
|
2.92
|
|
Nevada
|
3,492
|
1,617
|
3.54
|
3.21
|
|
New Hampshire
|
45,980
|
1,976
|
4.66
|
3.30
|
|
New Jersey
|
167
|
17
|
2.22
|
1.23
|
|
New Mexico
|
964
|
215
|
2.98
|
2.33
|
|
New York
|
459,199
|
29,355
|
5.66
|
4.47
|
|
North Carolina
|
66,876
|
7,074
|
4.83
|
3.85
|
|
North Dakota
|
10,941
|
1,720
|
4.04
|
3.24
|
|
Ohio
|
7,800
|
173
|
3.89
|
2.24
|
|
Oklahoma
|
47,943
|
2,865
|
4.68
|
3.46
|
|
Oregon
|
480,545
|
40,784
|
5.68
|
4.61
|
|
Pennsylvania
|
68,039
|
3,192
|
4.83
|
3.50
|
|
Puerto Rico
|
362
|
108
|
2.56
|
2.03
|
|
Rhode Island
|
339
|
6
|
2.53
|
0.78
|
|
South Carolina
|
63,407
|
3,885
|
4.80
|
3.59
|
|
South Dakota
|
41,116
|
4,267
|
4.61
|
3.63
|
|
Tennessee
|
159,743
|
11,758
|
5.20
|
4.07
|
|
Texas
|
15,825
|
1,566
|
4.20
|
3.19
|
|
Utah
|
1,880
|
481
|
3.27
|
2.68
|
|
Vermont
|
17,669
|
1,097
|
4.25
|
3.04
|
|
Virginia
|
22,854
|
4,052
|
4.36
|
3.61
|
|
Virgin Islands
|
0
|
0
|
|
|
|
Washington
|
670,103
|
87,295
|
5.83
|
4.94
|
|
West Virginia
|
32,707
|
1,329
|
4.51
|
3.12
|
|
Wisconsin
|
43,972
|
1,148
|
4.64
|
3.06
|
|
Wyoming
|
4,355
|
611
|
3.64
|
2.79
|
|
|
|