ABOUT UNITED STATES POPULATION, 1790-1940
Populations of organisms often show an S-shaped growth pattern, where population growth accelerates rapidly
in an early stage, then slows to little or no growth in a later stage. S-shaped or sigmoidal growth can be caused
by a number of factors, however a common interpretation involves an external limit to growth based on environmental
factors. Populations might be limited to some value (often referred to as the carrying capacity) because of finite
food resources, space, water, etc.
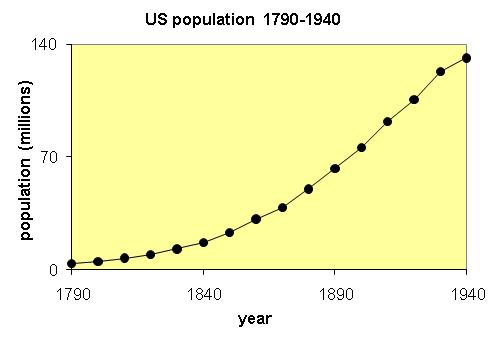
Data on US residents from 1790-1940 show an S-shaped curve of population as a function of time. The data were
obtained during the decadal census starting in 1790. One might ask how accurate these data are, and whether there
was overcounting, undercounting or both.
Sigmoidal growth curves are often modeled using a modified exponential model, the logistic model, where the
growth rate decreases as the population increases. The US population data for this limited time period fit a logistic
model very well. To model the data using logistic difference equations, students must choose reasonable values
for the initial population and initial time (tricky!), the carrying capacity, and the intitial/uninhibited growth
rate in the logistic model; none of these parameters are given in the actual data set.
The US population since 1940 is well known, and not surprisingly,
does not fit a logistic model at all. The best fit logistic model
of Pearl et al (1940) suggested a carrying capacity of about 180 million
US residents; the current population is about 270 million residents.
Pearl et al (1940) were very cautious, however, and would not even
speculate about the 1950 population, let alone that of the year 2000.
One might ask: why did the population appear logisitic over this time
period, and why did the US population turn out to be non-logistic?
Reference: Pearl, R., Reed, L. J. and Kish, J. F. (1940), The logistic curve and the census count of 1940; Science,
vol 92, no. 2395, pp. 486-488.