ABOUT MAXIMUM DAILY
OZONE IN SAN DIEGO
Ozone (O3)
is a compound of oxygen found both high in the stratosphere (the "good"
ozone blocking harmful ultraviolet radiation) and low in the troposphere
(the "bad" ozone that is the main part of photochemical
smog). Ozone is a potential harmful chemical to humans, as it will
interfere with the respiration, even at very low concentrations. Ozone
causes inflammation of airways that can reduce lung capacity, and
can result in permanent damage to lung tissue. The EPA has established
a federal standard for ozone concentration in the lower atmosphere
at .12 ppm (average concentration over 1 hour).
Air samples taken on Overland
Avenue in downtown San Diego during June, July and August of 1998
were analyzed for ozone and compiled by the California Air Resources
Board (CARB). The data were reported in several different fashions.
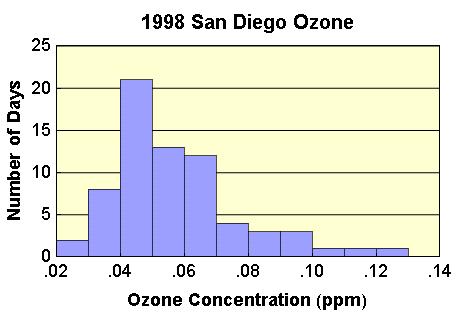
Maximum daily concentration of ozone measured over a 1 hour period
are given in the table and shown in the diagram.
The data can be displayed
and analyzed using a histogram, which shows a skew symmetric distribution
of maximum ozone values measured on 70 different days during the summer
of 1998 in San Diego. Skew symmetric distributions are quite useful
in illustrating to the student the differences between the mean, median
and mode. The mean ozone maximum is much lower than the federal standard,
however there was one day in August when the EPA standard was exceeded.
The choice of graphical
representation can obscure or illuminate the data; students should
learn that graphs are no substitute for the original data. Is there
some way of graphically representing this data set to "hide"
the one value that exceeds the federal standard?
Reference: Data were obtained
from CARB's wonderful website, which is a very valuable resource for
educators. Look under Air Quality Data: http://www.arb.ca.gov/html/aqe&m.htm
See also the South Coast
Air Quality Monitoring District website for southern California: http://www.aqmd.gov